1The problem
Our money lives in a lot of places: checking and savings at a couple of banks, credit cards, a few brokerages, retirement and health-savings accounts, an employer stock plan, and a mortgage. I got fed up managing it across all of those platforms.
The obvious fix is a personal-finance app, and I tried several. They all failed the same way: linking accounts kept breaking. A connection would silently drop, a brokerage would be supported for balances but not holdings, a stock plan would show shares with no usable cost basis. Each failure made the totals quietly wrong, and a dashboard you can't trust is worse than none, because you stop checking it.
So the real requirement wasn't more charts. It was a picture of the household's finances that stays correct when individual data sources misbehave, and that tells you plainly when it can't.
2Goals and non-goals
Goals
- One accurate picture of net worth, spending, and investments for two people, with each account assigned to an owner.
- Every account counts, including the ones no aggregator can reach, which are entered by hand.
- Honest about staleness. The board should say how old its numbers are and which feed is behind, not just whether the last sync threw an error.
- Readable without a finance background. Every figure has a one-line, plain-English explanation.
- Cheap and boring to run: no monthly bill, no build step, one file of data.
Non-goals
- Moving money. Every connection is read-only. The app never trades, pays, or transfers.
- Being a product. It serves exactly two people, so there is no signup, no tenancy, and no login screen of its own (see security for why that's safe).
- Giving advice. Stock grades and projections are labeled as rules of thumb and starting points for research.
3The shape of the system
It is deliberately small: a FastAPI backend, a single SQLite file, and a plain HTML, CSS, and JavaScript frontend served by the same process. Account sources plug in behind one interface, and everything the user sees is computed from snapshots the backend records on each refresh.
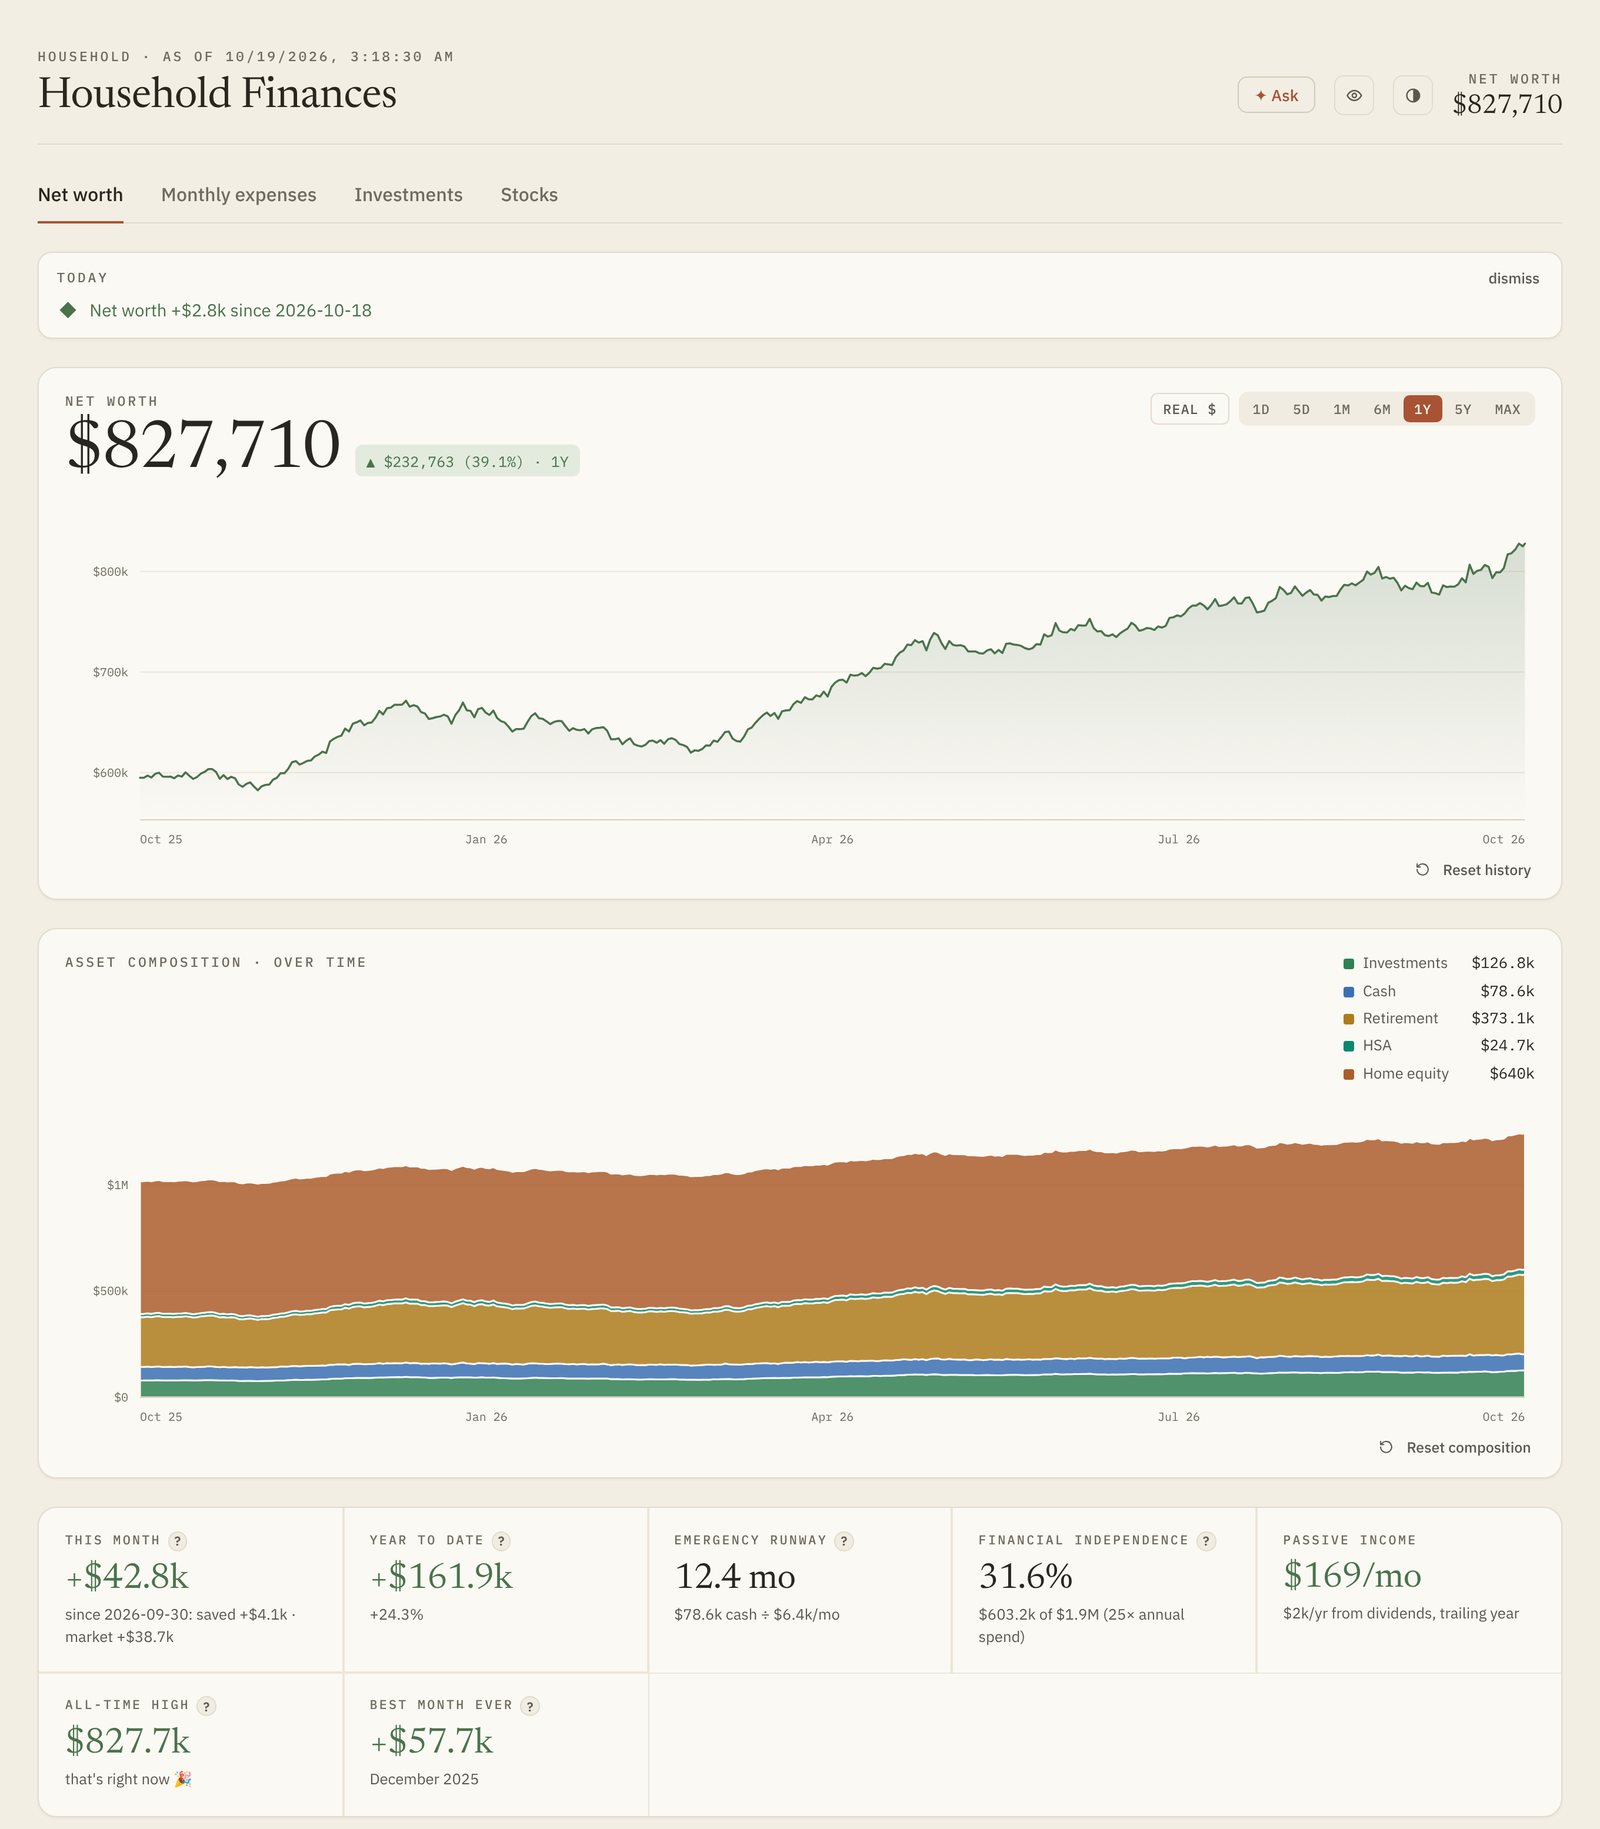
The four views (net worth, monthly expenses, investments, and a stock watchlist) are all read models over the same snapshots. A freshness strip above them reports the age of the data, measured per feed over exactly the accounts that feed reads, and names the laggard: "synced just now, but one brokerage's data only runs through last Tuesday."
4One interface for every source
The central decision is that the dashboard never knows how a balance was obtained. Every source is a Provider that returns Account records, and nothing downstream branches on where an account came from.
- A small, signed record. An account has a provider, institution, name, type, owner, an as-of time, and one signed balance: assets positive, liabilities negative. Net worth is then just the sum, with no special cases for loans or cards.
- Adding a source is one class. A bank aggregator, two brokerage aggregators, and a manual provider sit behind the same interface. A provider without its keys is simply skipped, so the app boots and shows whatever it can.
- One source of truth per institution. Some brokerages are reachable through more than one aggregator. When the richer feed covers an institution, the others stand down for it, so nothing is counted twice.
- Ownership is data, not layout. Each account carries an owner, set when linking or with an inline picker, and that alone decides which person's column it lands in.
5Bad data is the normal case
This is the section the whole project exists for. Aggregator feeds fail in ways that look exactly like real financial events: an expired login reads as an account emptying overnight, a newly linked account reads as a windfall. The design treats every one of these as expected and handles it explicitly.
- An outage is not an unlinking.
- If a provider, or a single bank login inside it, fails during a refresh, its last-known accounts are carried forward, flagged stale with their original timestamps. The snapshot never records them as missing, so net worth doesn't dip and history isn't rewritten.
- Failures are isolated.
- One bad provider can't blank the board, and one logged-out bank doesn't stop the others from syncing. The failed login gets a Reconnect button that repairs it in place.
- Linking an account backdates history.
- When accounts appear or disappear, the change in net worth caused purely by that structural change is computed and applied to earlier history, so connecting a new account doesn't draw a sudden gain.
- Charts filter outages on read.
- The composition chart drops snapshots whose asset total sits far below the surrounding median, a sign that accounts vanished mid-outage. It carries an individual account through gaps in its own feed, and skips the partial snapshots recorded while accounts were still being set up. The stored rows are never modified, and the newest point is always kept, because live state should be honest even when it's ugly.
- Returns only chain what both ends saw.
- The time-weighted return only links intervals that both endpoints cover, with a sanity clamp, so one absent account can't poison the reported performance.
- Read the meaning, not the sign.
- One card feed flipped its sign convention mid-stream, which silently dropped every purchase after the flip. The pipeline now reads each activity's type and never infers anything from the sign of an amount.
- Freshness has a heartbeat.
- A sync can succeed while the source's own copy is days old. Each feed records a heartbeat on success, and the provider's own "synced through" date is passed through, so the board can tell "the job ran" apart from "the data is current."
6Storage and derived insights
Everything lives in one SQLite file: encrypted provider tokens, accounts and owners, balance and holdings history, transactions, rules, budgets, equity lots, and a market-data cache. It runs in write-ahead-log mode, and schema migrations run automatically on startup, so deploying a change is just restarting the process.
Insights are derived, not stored. Goal arrival dates, financial-independence progress, savings-versus-market attribution, debt payoff pace, dividends, and concentration are all computed from history when asked for. That keeps a single source of truth and means a fix to a calculation applies retroactively. The expense pipeline is memoized on a data version that every write bumps, so the derived views stay fast without ever going stale.
Market data for the watchlist comes from two free-tier APIs. Price history is fetched at most once per trading day per ticker and persisted, rate limits (including daily caps) are detected and waited out, and a background loop backfills anything a burst couldn't cover. The tab serves cached data instantly and refreshes behind the scenes.
7Explainable categorization
Spending is only useful if the categories are right, and you only trust categories you can audit. Each transaction goes through a fixed priority order:
- bills that should count once, even when they appear through two accounts;
- the household's own learned rules, matched on word boundaries with the longest match winning;
- built-in merchant overrides;
- the bank feed's own category;
- merchant keywords.
Raw bank-transfer descriptors are parsed down to the originating company, so those rows read as a merchant name and a card issuer's statement pull is recognized as a payment rather than as spending. Every transaction shows why it landed in its category, a command-line tool explains any payee's treatment, and one dialog lists every stored override so mistakes are easy to find and delete.
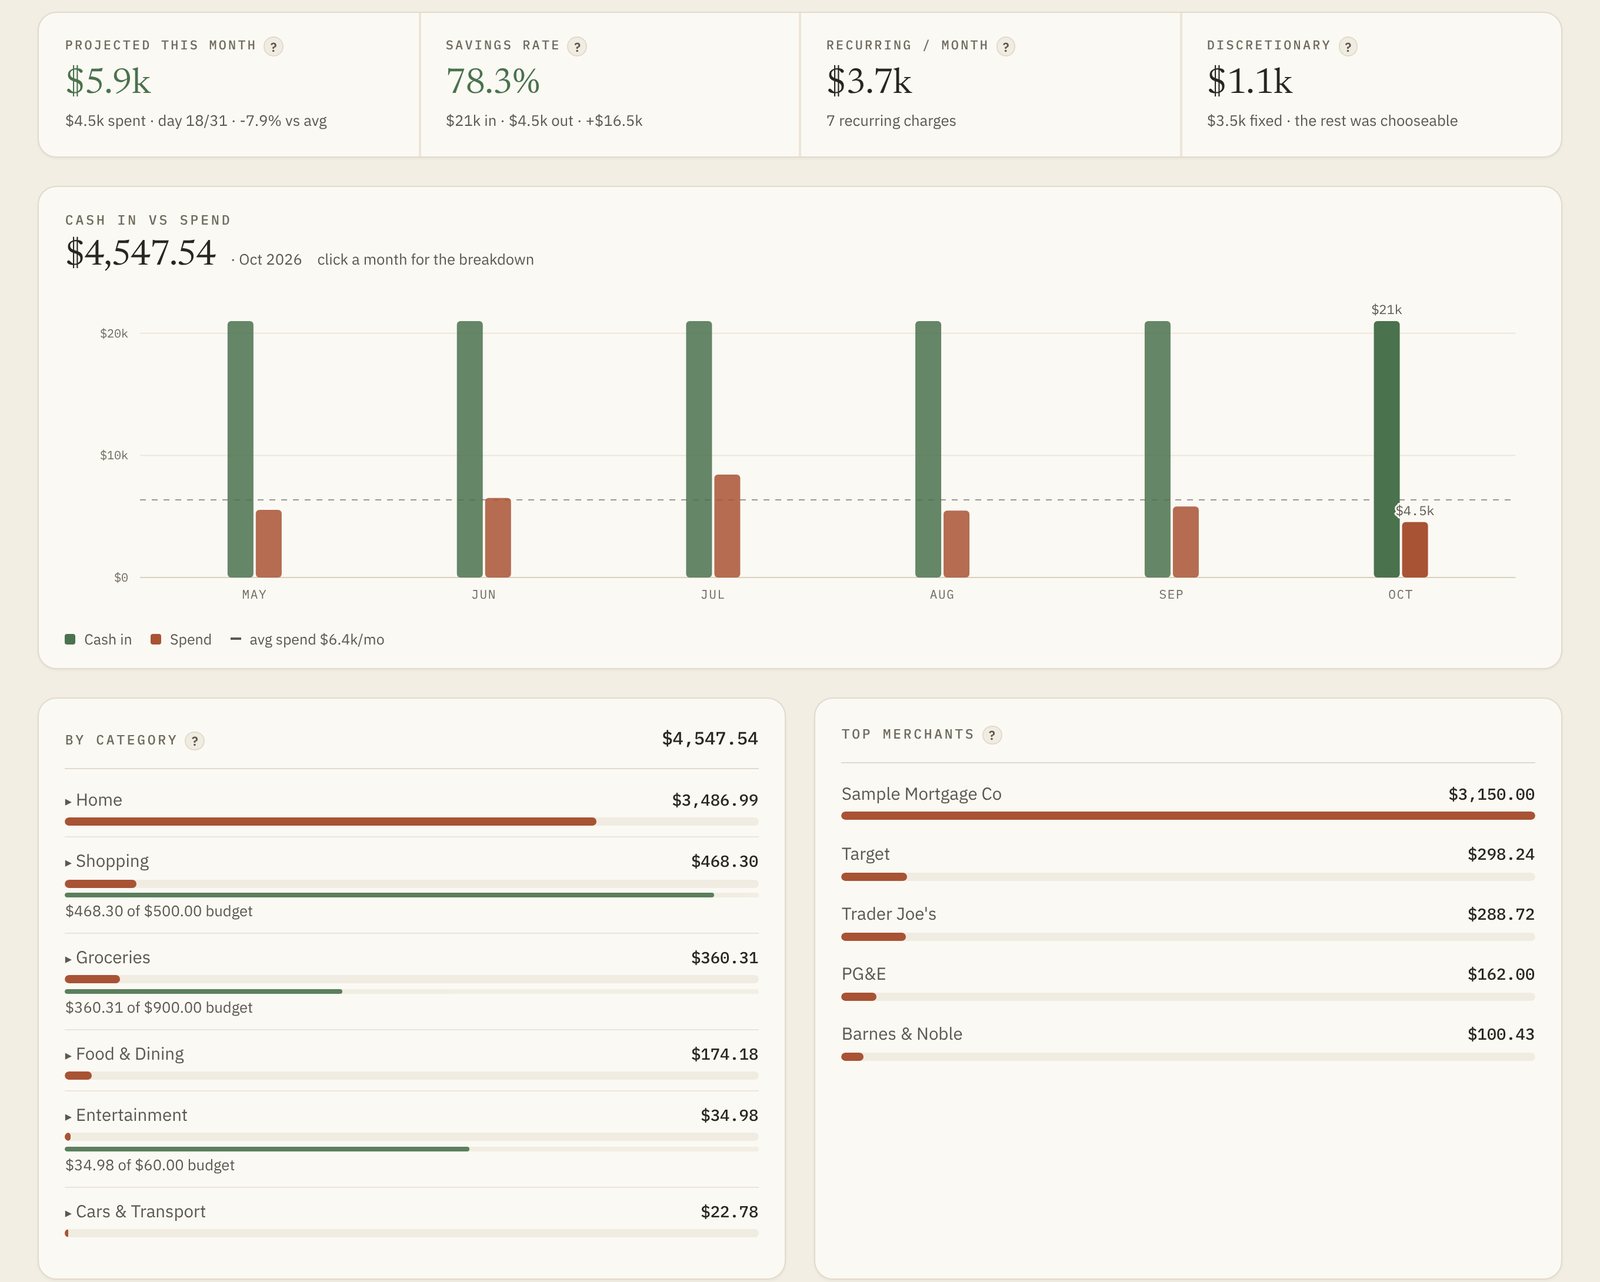
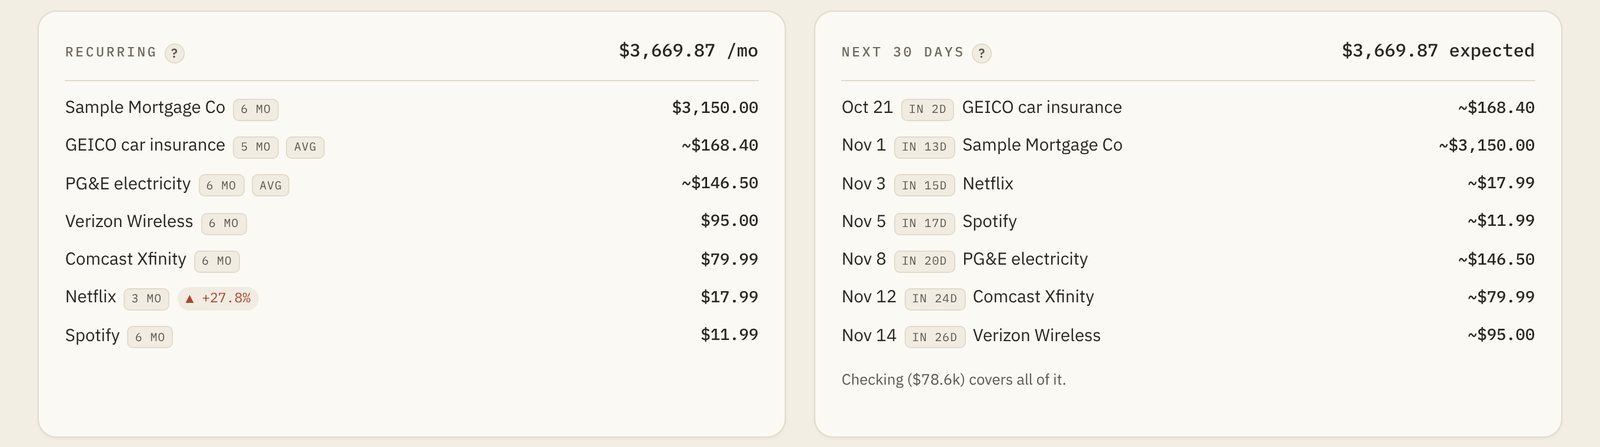
On top of that sit the views that make a month legible: projected month-end against the average, recurring charges with price-rise flags, an upcoming-bills forecast, a fixed-versus-discretionary split, per-category budgets, and search and export over the past year.
8Investments and equity
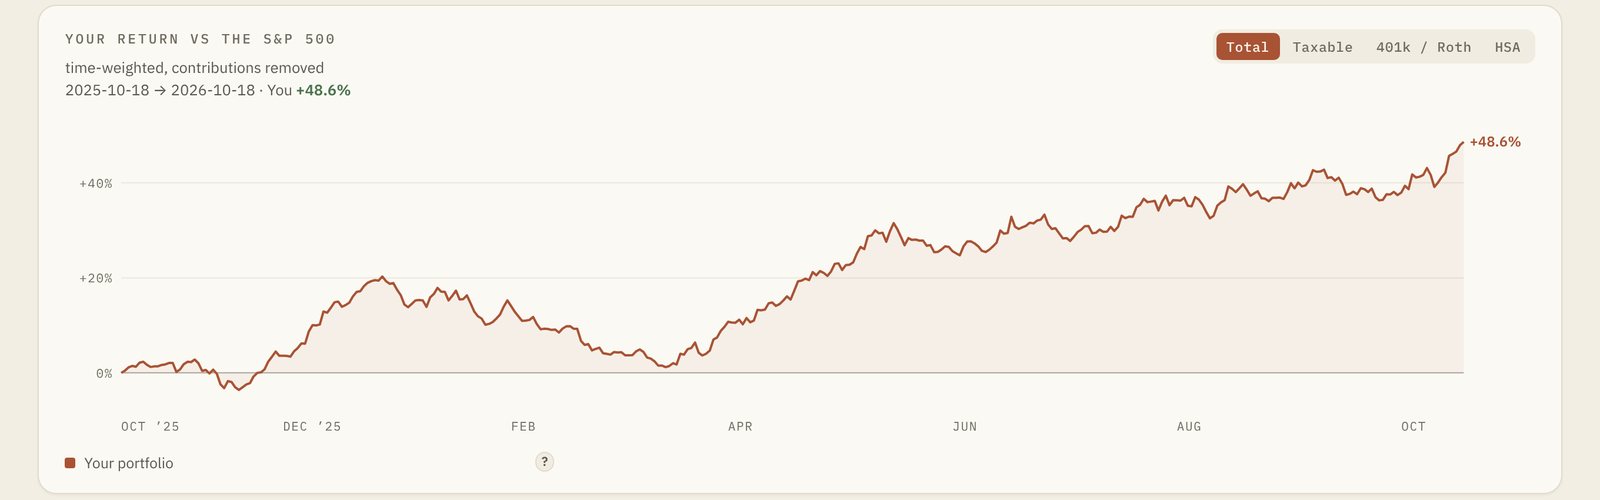
Performance is shown as a time-weighted return against the S&P 500, which removes the distortion of contributions and withdrawals, with a scope picker to view any one sleeve (taxable, stock plan, retirement, health savings) on its own.
Brokerage feeds describe vested stock awards poorly, usually as shares with no usable cost basis. Rather than show a wrong gain, the dashboard shows value without a percentage and instead reads the stock-plan export directly. Parsing it recovers each lot's true vest-day basis and the future vest schedule, which unlocks a vest calendar, a sell simulator that picks lots in the cheapest-tax order and splits the result into long- and short-term, and projections that know about income still to come. A nudge after a real sale (as opposed to sell-to-cover, which is just withholding) estimates what to set aside for tax.
For planning, a projector runs the household's savings rate forward with a Monte Carlo fan, optional home-purchase events, and the vest schedule folded in. A saved run becomes a dashed line on the history chart that you can track against, and a "fire drill" answers the opposite question: if the paychecks stopped today, how long would the money last?
9Claude, on a short leash
Four features call Claude: a question box over your own finances, a short weekly read on spending, auto-categorization of whatever is still uncategorized, and a written management discussion for a printable quarterly review. They share three rules.
- It sees a summary, not the database. Questions are answered from a compact snapshot of derived figures, with an explicit instruction to say what's missing rather than guess.
- It proposes; people decide. Suggested categories are validated against the real category list and applied only after approval. Nothing Claude produces writes to the data on its own.
- It's off until you turn it on. The API key is pasted into the app once and stored encrypted in the database, never in configuration files, and every feature stays inert without it.
10Security and privacy
The app has no login screen, which is only acceptable because it is never on the open internet. It binds to localhost on a small cloud VM with no open web ports. The only way in is an outbound-only tunnel fronted by an access gate that allows exactly two email addresses, checked before a request ever reaches the machine.
- Secrets never go in git. The repository is code only; configuration and data are ignored.
- Encrypted at rest. Provider tokens and the API key are encrypted with a key that has to travel with the database, so a copy of one without the other is useless.
- Read-only everywhere. No connection can move money.
- Privacy mode. A toggle in the header blurs every dollar figure, for showing the dashboard to someone without showing them your balances.
- Unlinking means gone. Removing a connection revokes it at the provider and purges its stored transactions.
11Running it
It runs on an always-free cloud VM. The box pulls the main branch every few minutes and redeploys itself, so shipping a change is a push. The app refreshes itself each morning, so the board is current before anyone opens it, rather than relying on a timer nobody would see fail.
Backups are taken nightly with SQLite's own online backup and verified (an integrity check and a row-count comparison against the live database) before older ones rotate out; a failed check exits loudly. A Monday email digest summarizes all four views and can attach an encrypted snapshot of the database, which doubles as an off-machine backup.
The frontend has no build step. Charts are hand-drawn SVG sized to their container, so axis labels stay readable on a phone and on a wide monitor alike, and the whole interface works in light and dark themes. Tests cover categorization and the stock scorecard as pure functions, the market cache's rate-limit behavior, and the API itself, booted against a scratch database with the provider SDKs stubbed.